Security budgets are notoriously difficult to justify. The investment prevents something that may or may not happen, produces no visible product, and is evaluated against a counterfactual the breach that did not occur that has no observable value until the alternative plays out. The CFO looking at a six-figure penetration testing line item and asking "what are we getting for this?" is asking a legitimate question that the security team is rarely equipped to answer with numbers.
This post is an attempt to answer that question with numbers. Specifically: what does it actually cost to run 100 security scans per month the cadence that corresponds to meaningful continuous coverage for a team deploying frequently and what are you getting for that cost compared to the alternatives?
The alternatives are worth naming precisely: the annual penetration test that most organizations currently run, and the hybrid model that combines periodic human-led assessment with continuous automated scanning. The comparison is not simple, because the three models provide different types of coverage, catch different vulnerabilities, and produce different relationships between testing cadence and the rate of change in the application being tested.
The numbers in this analysis are modeled from publicly available penetration testing market data, security consulting firm rate cards, breach cost research from IBM's Cost of a Data Breach report, and the coverage implications of different testing cadences. They are representative rather than exact your specific costs will vary based on your stack, your team, your deployment cadence, and your geography. The model is the useful thing, not any specific number within it.
The Baseline: What Annual Penetration Testing Actually Costs
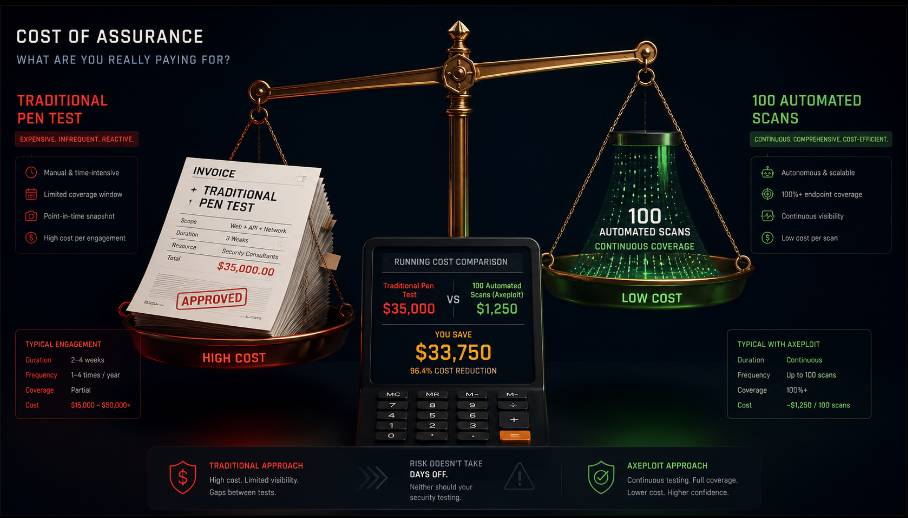
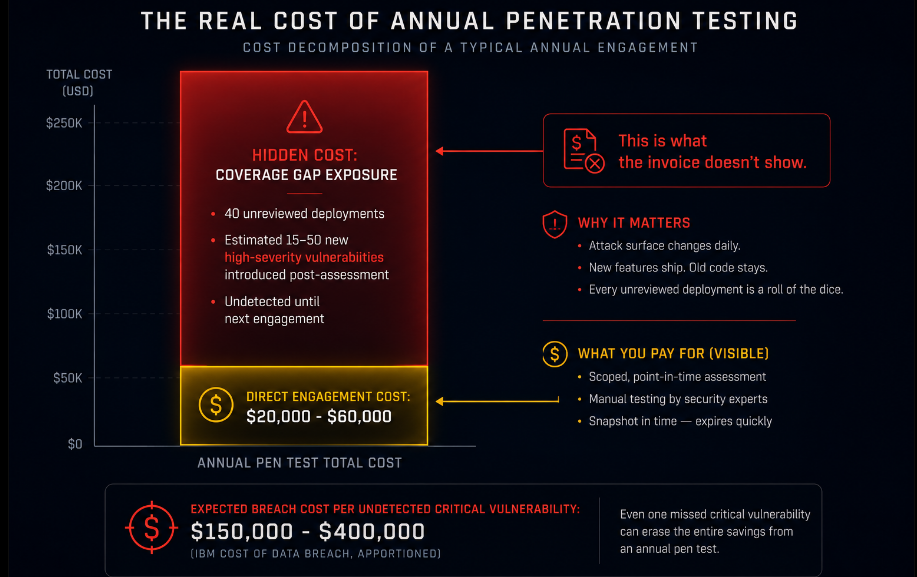
The traditional penetration testing market operates on day rates. Senior penetration testers at established security consulting firms bill between $2,000 and $4,000 per day depending on geography, firm reputation, and specialization. A typical web application penetration test runs ten to fifteen tester-days for a mid-sized SaaS application. This produces a cost of $20,000 to $60,000 per engagement.
This is the invoice cost. It is not the total cost.
The hidden cost of annual testing is the coverage gap it leaves open.
A penetration test conducted in March covers the application as it exists in March. A team deploying weekly will ship approximately 40 releases between the March test and the next engagement in March of the following year. Each release potentially introduces new endpoints, new authorization boundaries, new third-party integrations, and new attack surface. None of that surface is covered by the March engagement.
The total cost of annual testing is therefore the engagement fee plus the expected cost of the vulnerabilities introduced in the coverage gap. Quantifying the latter requires an estimate of how many exploitable vulnerabilities a team introduces per year of development, what fraction of those would be found by a pen test if one were conducted, and what the cost of each vulnerability being exploited would be.
Research from Veracode and similar sources suggests that typical web applications have between 0.15 and 0.5 high-severity vulnerabilities per 1,000 lines of new code. A team shipping 50 releases per year, each adding several thousand lines of net-new code, is introducing 15 to 50 high-severity vulnerabilities per year in expectation. An annual pen test finds the ones present at test time. The ones introduced afterward remain undetected until the next engagement or until an attacker finds them first.
The Continuous Model: What 100 Scans Actually Means
Before pricing 100 scans per month, it is worth being specific about what a scan means in the context of autonomous AI security testing versus what it means in a traditional context.
A traditional scan, in DAST terms, is a crawl-and-probe cycle against a target URL typically lasting from minutes to hours, covering the unauthenticated surface, and producing a list of findings based on signature matching. 100 of these per month provides high-volume low-depth coverage: many runs, each finding the same surface-level issues repeatedly.
An autonomous AI agent scan is a different unit of work. A single scan involves: account registration and authentication flow navigation, authenticated surface mapping, multi-session cross-account testing for authorization vulnerabilities, active testing with 7,500+ checks applied contextually, and proof-of-concept verification before a finding is logged. A scan covers the full authenticated application surface and produces verified findings. 100 of these per month is not 100 repetitions of the same shallow probe it is 100 full-depth security assessments against whatever version of the application is running at scan time.
For a team deploying daily, 100 scans per month is approximately 3 to 4 scans per deployment. For a team deploying weekly, it is roughly 25 scans per deployment. For a team running pre-merge security gates, it might correspond to scan-per-PR on a moderately active repository.
The meaningful question is not "how many scans" but "what coverage does this provide?" and specifically, whether the coverage corresponds to the rate at which the application is changing.
Three Cost Models Compared
The comparison that matters most is not continuous AI scanning in isolation but continuous AI scanning versus the alternatives, across different company sizes and deployment cadences.
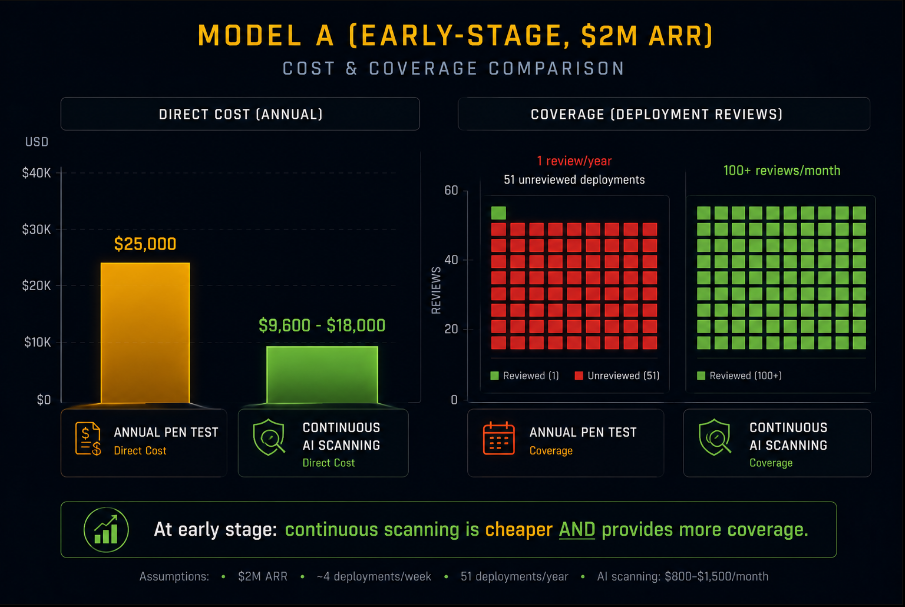
Model A: Early-Stage Team, Weekly Deployments, $2M ARR
Annual pen test model:
- One annual penetration test at the lower end of market rate: $25,000
- Deployment cadence: 52 deployments per year
- Coverage after pen test: application tested once; the 51 subsequent deployments are unreviewed
- Time-to-detection for post-assessment vulnerabilities: up to 12 months
- Total direct spend: $25,000/year
Continuous AI scanning model (100 scans/month at market-competitive rates):
- Continuous scanning program at representative pricing: $800 to $1,500/month
- Annual equivalent: $9,600 to $18,000/year
- Coverage: each deployment scanned multiple times, authorization and authentication testing on every scan, verified findings on each run
- Time-to-detection: hours to days per deployment
- Total direct spend: $9,600 to $18,000/year
At this stage and scale, continuous AI scanning is not more expensive than annual penetration testing it is cheaper in direct cost, while providing coverage that is continuous rather than point-in-time. The cost differential inverts the usual assumption that continuous coverage requires a premium.
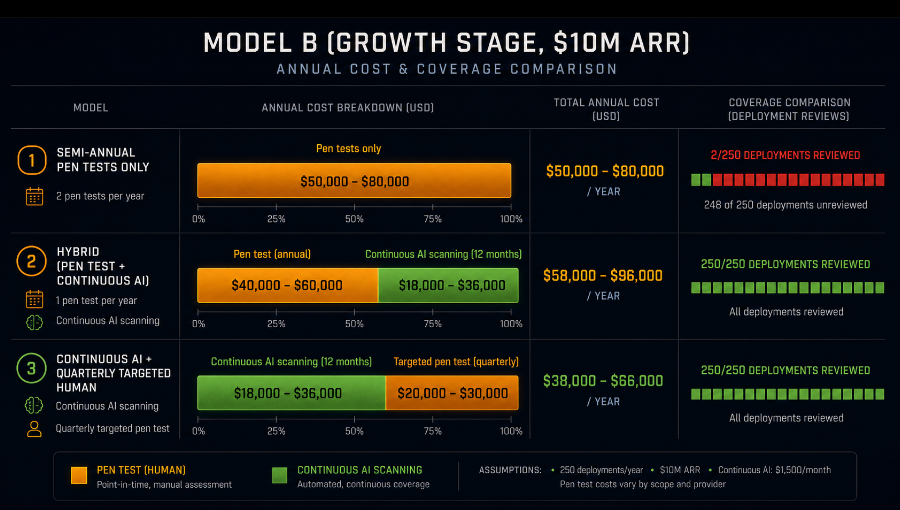
Model B: Growth-Stage Team, Daily Deployments, $10M ARR
Annual pen test model:
- Two engagements per year (semi-annual, which represents above-average practice): $50,000 to $80,000
- Deployment cadence: 250 deployments per year
- Coverage: 2 reviews, 248 unreviewed deployments
- Time-to-detection: up to 6 months per cohort of post-assessment vulnerabilities
- Total direct spend: $50,000 to $80,000/year
Hybrid model (semi-annual human pen test + continuous AI scanning):
- Semi-annual human pen test for depth and complex business logic: $40,000 to $60,000
- Continuous AI scanning for continuous coverage: $1,500 to $3,000/month ($18,000 to $36,000/year)
- Combined annual spend: $58,000 to $96,000/year
- Coverage: 2 deep human reviews plus continuous automated coverage — every deployment reviewed within hours
Continuous AI scanning only:
- $1,500 to $3,000/month ($18,000 to $36,000/year)
- Coverage: every deployment reviewed, 7,500+ checks, verified findings
- Gap: complex multi-signal business logic vulnerabilities that require human intuition addressed by quarterly targeted human assessment of highest-risk features ($20,000 to $30,000/year)
- Combined: $38,000 to $66,000/year
At growth stage, the hybrid model provides the most complete coverage. Continuous AI scanning provides the coverage density that daily deployments require. Periodic human assessment provides the depth for the vulnerability classes that require it. The combined cost is comparable to or below semi-annual penetration testing alone, while providing meaningfully better coverage.
Model C: Scale-Stage Company, Multiple Daily Deployments, $50M+ ARR
At scale, the economics shift in a different direction. The security team is larger, the compliance requirements are more demanding, and the enterprise customer base expects evidence of both continuous monitoring and periodic independent assessment.
Current-state typical spend:
- Annual penetration test (comprehensive scope): $80,000 to $150,000
- Web application firewall and related tooling: $50,000 to $100,000/year
- Security scanning tools (SAST, SCA, DAST): $40,000 to $80,000/year
- Security engineer time allocated to manual review: 0.5 to 1 FTE ($75,000 to $150,000 in fully-loaded cost)
- Total: $245,000 to $480,000/year
Optimized model with continuous AI scanning:
- Quarterly targeted penetration tests (focused on highest-risk areas, new features, architecture changes): $80,000 to $120,000/year
- Continuous AI scanning (replacing much of the DAST spend and manual review time): $3,000 to $6,000/month ($36,000 to $72,000/year)
- SAST and SCA (retained): $30,000 to $50,000/year
- Security engineer time redirected to architecture review and remediation (vs. manual testing): 0.25 FTE freed for other work
- Total: $146,000 to $242,000/year
The optimization at scale produces a meaningful cost reduction while improving coverage density because the continuous AI scanning covers every deployment rather than periodic snapshots, and the quarterly human assessments are more targeted and therefore more efficient than comprehensive annual sweeps.
The Breach Cost Equation
Direct security spend comparisons miss the more important economic variable: the expected cost of breaches that different testing models prevent or fail to prevent.
IBM's Cost of a Data Breach report (2024) puts the average total cost of a data breach at $4.88 million globally, with SaaS and cloud-related breaches trending higher. This number is the 18-month fully-loaded cost described in an earlier post in this series direct incident costs, customer churn, regulatory and legal exposure, engineering remediation, and the growth impact of the period following a breach.
For a $10M ARR company, a breach that results in 20% customer churn and six months of compressed growth trajectory can reduce the business's value by $5 to $15 million an order of magnitude larger than the annual security testing spend being evaluated.
The relevant calculation is not "what does the security program cost?" but "what is the expected value of breaches the program prevents?" This requires three inputs: the probability of a breach in a given year without the testing program, the fraction by which the testing program reduces that probability, and the cost of a breach given it occurs.
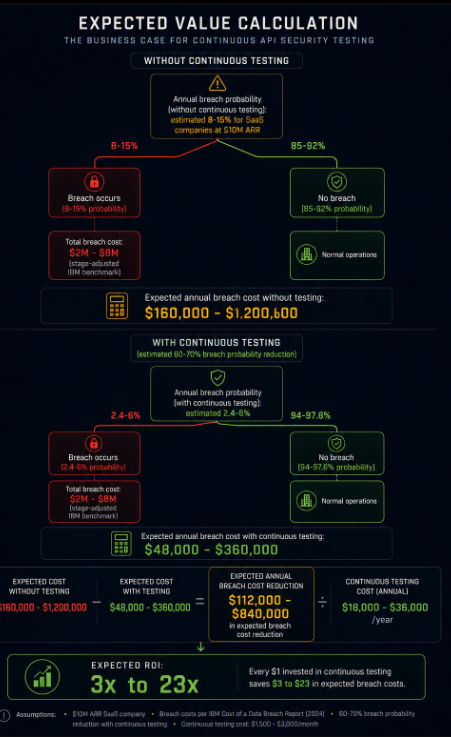
A growth-stage SaaS company has an estimated annual breach probability accounting for all attack vectors, not just application vulnerabilities of 8 to 15 percent based on industry data. A continuous security testing program that reduces exploitable vulnerability exposure by 60 to 70 percent (a conservative estimate given that application vulnerabilities are a primary attack vector) reduces that probability materially.
At an 8% breach probability and a $4M average breach cost, the expected annual breach cost without a robust testing program is approximately $320,000. A continuous security testing program that costs $36,000 per year and reduces the breach probability by 60% reduces the expected cost to $128,000 a net expected value improvement of $192,000 against a $36,000 investment. That is a 5.3x expected return on security testing spend before accounting for the direct cost savings from replacing higher-cost testing alternatives.
The numbers are estimates. The direction is not.
What Drives the Cost of 100 Scans
Not all scans cost the same, and understanding what drives the cost helps evaluate different approaches.
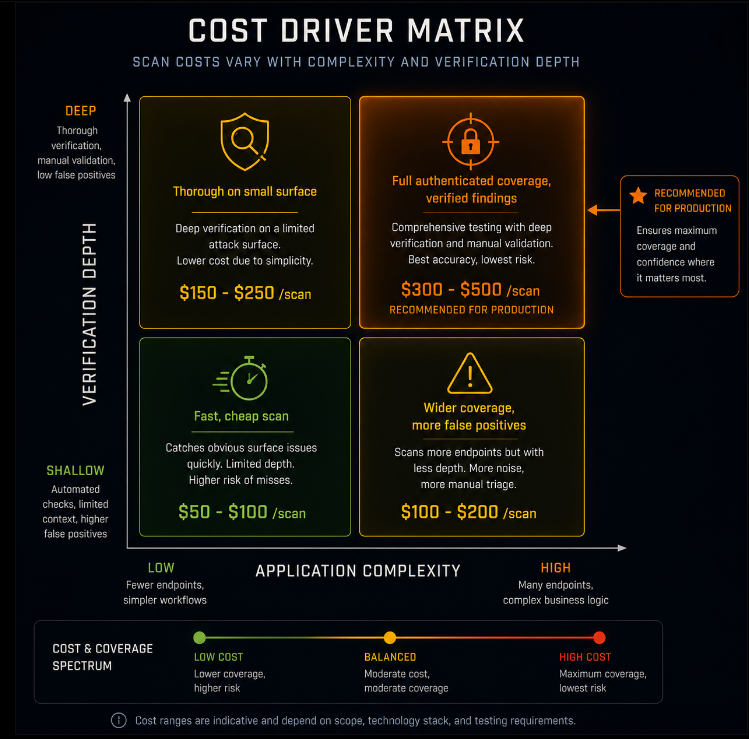
Authentication complexity. An application with a simple email/password login flow is less expensive to scan than one requiring TOML-based MFA, hardware key support, or complex OAuth flows. Autonomous agent scans that support complex authentication flows cost more to run but provide coverage that simpler scans cannot.
Application surface area. A twenty-endpoint API costs less to scan thoroughly than a five-hundred-endpoint API with complex nested resources. Cost per scan scales with the application surface being covered.
Verification depth. Scans that verify findings as confirmed exploits before reporting them producing no false positives but requiring more test iterations cost more per finding than scans that flag potential vulnerabilities for manual verification. The false-positive cost, borne by security engineers who investigate flags that turn out to be clean, needs to be included in the total cost model.
Scan frequency versus depth tradeoff. A model that runs 100 shallow scans costs differently than one that runs 20 deep scans. For continuous coverage across many deployments, frequent lighter-touch scans that cover the highest-priority vulnerability classes provide better time-to-detection than fewer comprehensive scans.
Making the Business Case Internally
The practical challenge for most security engineers and DevSecOps teams is not understanding the economics it is presenting them in a form that moves an internal budget conversation forward.
The argument that works is not "we need this tool because security is important." It is a specific expected value calculation tied to the company's actual situation:
State the breach probability honestly. Use industry data calibrated to your company's size, industry, and technology stack. Gartner, IBM, and Verizon's DBIR all publish sector-specific breach probability estimates.
State the breach cost realistically. Not just the incident response cost the 18-month total including customer churn, regulatory exposure, and growth impact. The 18-month total for a $10M ARR company ranges from $2M to $8M depending on data sensitivity and customer concentration.
Calculate the expected annual cost of breaches without improved coverage. Probability times cost, summed across the probability distribution.
Show what the testing program costs, including total cost of ownership. Subscription or per-scan cost plus security engineer time for remediation, not just the tool cost.
Show the expected breach cost reduction. Conservative estimates of how much the testing program reduces exploitable vulnerability exposure, with citation for the relationship between vulnerability coverage and breach probability.
Present the expected ROI. Expected breach cost reduction minus program cost, divided by program cost. A 3x to 10x expected ROI is a credible range for a well-structured continuous security testing program. Numbers above 10x should come with explicit statements of the assumptions driving them.
This framing respects the CFO's question as a legitimate one and answers it with the specificity it deserves. The alternative treating security spending as a cost center to be justified by compliance requirements produces security programs that are sized to compliance minimums rather than to actual risk exposure.
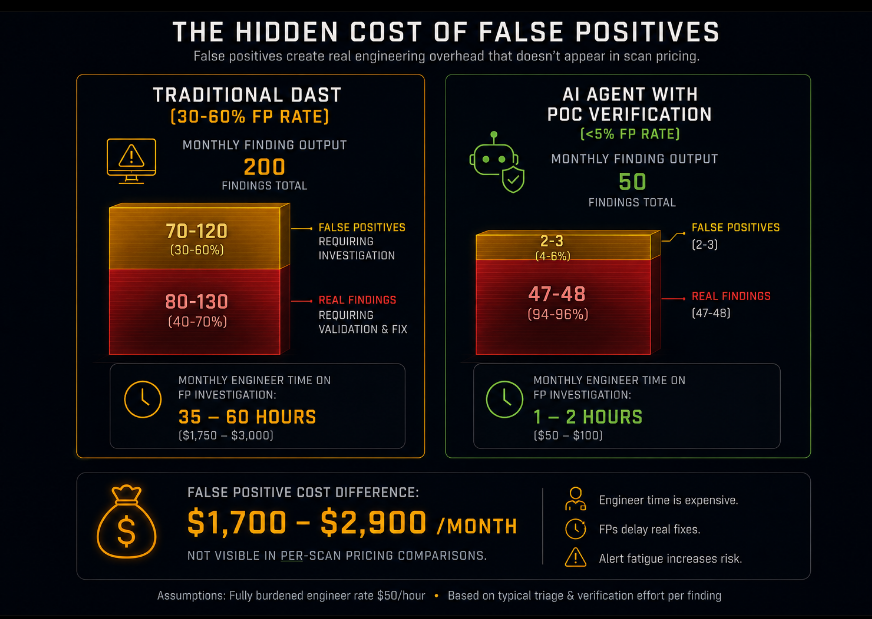
The Hidden Cost Nobody Includes: Engineer Time on False Positives
One cost that rarely appears in security tool comparisons is the cost of false positive remediation the engineering time spent investigating alerts that turn out to be incorrect.
A traditional DAST tool running at high volume can produce false positive rates of 30 to 60 percent. For a tool generating 200 findings per month, that is 60 to 120 false positive investigations per month. If each investigation takes 30 minutes of a senior engineer's time, and a senior engineer costs $150,000 per year in fully-loaded compensation, that is $30 to $60 per false positive investigation $1,800 to $7,200 per month in wasted engineering time.
An autonomous AI agent with a verified proof-of-concept policy and a false positive rate under 5% produces 0 to 10 false positive investigations per month from the same finding volume. The difference in engineering time cost $1,500 to $6,500 per month is a real cost savings that does not appear in any per-scan pricing comparison but is immediately visible in engineering team productivity.
Closing: The Cost That Gets Ignored Is the Coverage Gap
Every security testing budget conversation focuses on the direct cost of the testing itself. The number on the invoice. The number on the per-scan pricing page. These numbers are the visible part of the security economics equation.
The invisible part the part that determines whether the investment makes sense is the expected cost of the coverage gap. The 51 deployments per year that the annual penetration test does not cover. The authorization vulnerability introduced in the deployment after the assessment that sits undetected for eleven months. The breach that occurs because a newly-introduced BOLA vulnerability was never tested.
100 scans per month is not a volume metric. It is a coverage metric. It says: every deployment that matters gets tested at the depth needed to find the vulnerabilities that matter. The coverage gap is closed not by spending more on a single annual engagement but by testing at the cadence the application actually changes at.
The economics of continuous AI security testing work in the security team's favor at every stage modeled above. At early stage, it is cheaper than annual penetration testing and provides more coverage. At growth stage, the hybrid model provides enterprise-grade coverage at comparable cost. At scale, it reduces total security spend while improving coverage density.
The question is not whether 100 scans a month costs too much. The question is what the 364 days between annual penetration tests cost you in expected breach exposure and whether that cost is visible in the budget conversation you are having.
Axeploit is built to provide the coverage density that this post's economics describe. Scans that authenticate autonomously, cover the full application surface, run 7,500+ contextual checks, and report only verified findings at the cadence your deployment schedule demands. The cost model for 100 scans per month is designed to be competitive with the direct cost of annual testing while closing the coverage gap that annual testing leaves open every day it is not running.